
www.NewBedfordPD.com
Chief Paul Oliveira
Annual Crime Report
2022
Police Department
NEW BEDFORD

www.NewBedfordPD.com
2022 HIGHLIGHTS
➢ JJ Montalban sworn in as
an honorary police
officer
➢ Award and Promotional
ceremony at the Whaling
Museum
➢ Comfort Dog “Rosie”
joins the PD
➢ Historic year for drug and
cash seizures
2022 HIGHLIGHTS
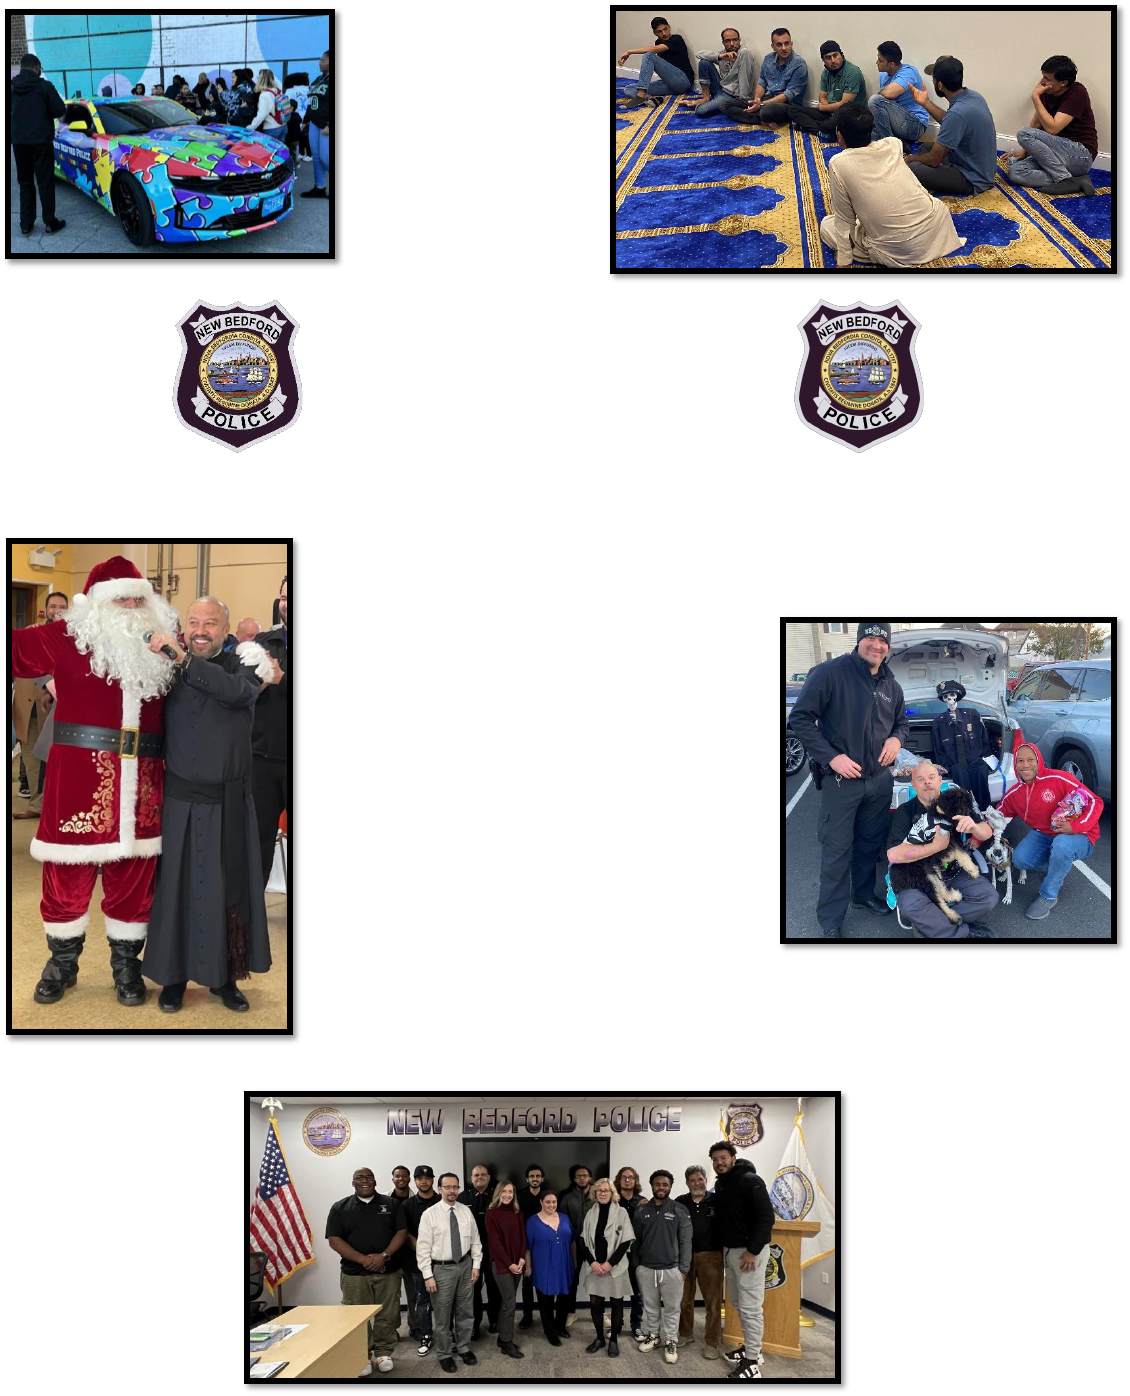
➢ Presentation for Afghan
refugees
➢ Liaison program with
Central American
community
➢ Trunk or Treat at Station
#2
➢ Autism Cruiser revealed
➢ Citizen’s academy
resumes
www.NewBedfordPD.com

The New Bedford police department is an organization of law enforcement professionals committed to
their mission of maintaining order, enforcing law, and building trust within the community. Not only do we
expect our officers to execute this mission, but we insist that it be done with respect to the rights and freedoms
granted to all citizens under the constitution. New Bedford officers experienced a very active year as we emerged
from a global pandemic during which most of our population were isolated. As people began to leave their
homes and once again returned to normal activity on the streets, our calls for service rose proportionally.
We continue to adapt to the many changes that have been instituted in the American law enforcement
profession. These changes include the establishment of POST (Peace Officer Standards & Training), a newly
formed government body of oversight that regulates the certification of police officers. As POST continues to
shape its reporting requirements, we continue to cooperate by transmitting all the pertinent information they
request. This provides the state with the critical ability to identify problematic law enforcement officers and
either retrain them or terminate their employment before their actions lead to tragedy.
Our focus has shifted to be less upon engagement and more upon de-escalation, as our department has
initiated ICAT training (Integrated Communication, Assessment & Tactics). Every member of the department
will be completing this class which will provide them with the tools necessary to approach volatile situations
from a fresh perspective, one in which we embrace the concept of using time to consider a wider range of
responses, solutions, and reactions. I believe this is ground-breaking training that will lead to better future
outcomes for officers and citizens alike.
I remain excited and hopeful for 2023. The safety of the city is in the hands of an amazing group of men
and women who work tirelessly in the performance of their duties, many times with a selfless disregard for their
own. I am proud to be the leader of this organization, and equally proud to be a member of this community.
Sincerely,
Chief Paul Oliveira
www.NewBedfordPD.com
New Bedford Police Department, Annual Report, 2022 | 1
1. Contents
1. Contents .................................................................................................................................................... 1
2. Methodology ............................................................................................................................................. 3
1. Best Data at the Time........................................................................................................................ 3
2. Crime Incident Calculations .............................................................................................................. 3
3. Demographics ................................................................................................................................... 3
4. Arrest Calculations ............................................................................................................................ 4
5. Calls For Service ................................................................................................................................ 4
6. Mapping ............................................................................................................................................ 4
3. Overview ................................................................................................................................................... 5
4. Homicide ................................................................................................................................................... 6
5. Sexual Assault ........................................................................................................................................... 8
6. Robbery ..................................................................................................................................................... 9
7. Assault ..................................................................................................................................................... 11
1. Aggravated Assaults ........................................................................................................................ 11
2. Simple Assaults ............................................................................................................................... 13
8. Burglary/B&E ........................................................................................................................................... 15
9. Larceny .................................................................................................................................................... 16
1. Catalytic Converters ........................................................................................................................ 17
10. Arson ..................................................................................................................................................... 18
11. Motor Vehicle Theft .............................................................................................................................. 20
12. Arrests ................................................................................................................................................... 24
1. Arrest Demographics ...................................................................................................................... 25
2. Arrests By Age Group ...................................................................................................................... 26
3. Arrests By Sex .................................................................................................................................. 26
4. Juvenile Arrests ............................................................................................................................... 27
5. Firearm Arrests & Seizures .............................................................................................................. 27
6. Drug Arrests .................................................................................................................................... 28
13. Shots Fired ............................................................................................................................................ 29
14. Calls for Service ..................................................................................................................................... 32
1. Call Reasons .................................................................................................................................... 33
15. Mental Health ....................................................................................................................................... 35
1. MH1 ................................................................................................................................................. 35
2. Co-Response Clinician (Child & Family Services, Inc.) ..................................................................... 35
2 | New Bedford Police Department, Annual Report, 2022
16. Domestic Violence ................................................................................................................................ 36
1. Domestic Verbal Arguments ........................................................................................................... 36
2. Domestic Assaults ........................................................................................................................... 36
17. Overdoses ............................................................................................................................................. 39
1. Demographics ................................................................................................................................. 39
18. Traffic .................................................................................................................................................... 41
1. Traffic Stops .................................................................................................................................... 41
2. Citations .......................................................................................................................................... 42

New Bedford Police Department, Annual Report, 2022 | 3
2. Methodology
In addition to specific methodological methodologies listed throughout this report, general methodology
can be found below.
1. Best Data at the Time
All statistics, including yearly totals, are calculated using the best available data at the time. Occasionally,
after our reports are published, factors determined during investigation will cause us to reclassify a crime
to a higher or lower category, and discrepancies between current and past reports may result. In all cases,
the more recent data is the more correct data.
2. Crime Incident Calculations
Crime incidents are calculated in this report using NIBRS categories, without hierarchy calculation and
with related/duplicate incidents excluded. That is, incidents with offenses in multiple categories will count
to each category for which an offense is present, multiple arrests from a single incident are counted as
one incident, and arrests where there is also an incident report are excluded. Incidents with multiple
offense categories within a NIBRS category, such as Larceny/Theft Offenses (23A-H) or Sex Offenses (11A-
D; 36A-B,360), are counted once to the NIBRS category as indicated in the report, rather than once per
unique offense category. In the case of assaults, simple assaults are excluded where an aggravated assault
charge is also present.
As such, the numbers reported in this document will vary from those calculated by the FBI UCR/NIBRS
program, with the variation differing depending on the characteristics of each NIBRS category and their
position within the NIBRS hierarchy. A comparison of prior FBI UCR/NIBRS data indicates that trends are
similar in nature to those found in this report.
3. Demographics
The categories used by New Bedford Police Department’s (NBPD) Record Management System (RMS) to
record race data follow FBI UCR Program categories and are outlined below in Table 2.3.1. These
categories can be compared with Census race categories provided in Table 2.3.2. Of note in the New
Bedford context two Census categories in the 2022 Decennial Census
1
that are not present in the NBPD
RMS, Some Other Race alone and Two or more races, comprised approximately 31% (total) of the New
Bedford population.
An individual’s race in the NBPD’s RMS is obtained from a range of various sources, including partner
agencies and officer observation. A record of the source and when it was entered or updated is not stored
within the RMS.
For these reasons, comparing NBPD’s race populations with self-reported census data is problematic and
cautioned against.
1
Data source: 2020: DEC Redistricting Data (PL 94-171)

4 | New Bedford Police Department, Annual Report, 2022
Table 2.3.1: NBPD RMS/NIBRS Race Categories.
Race Category
Asian
Black
American Indian/Alaskan Native
Native Hawaiian or Other Pacific Islander
White
Unknown
Table 2.3.2: Census Race Categories.
Race Category
Asian alone
Black or African American alone
American Indian and Alaskan Native alone
Hawaiian or Other Pacific Islander alone
White alone
Some Other Race alone
Two or more races
Also following FBI UCR Program protocol is the ethnicity of individuals, which is stored in the NBPD RMS
as a separate variable and comprises the three categories listed in Table 3.2.3. As with race data, an
individual’s ethnicity in the NBPD’s RMS is obtained from a range of various sources, including partner
agencies and officer observation. A record of the source and when it was entered or updated is not stored
within the RMS. Again, for these reasons, comparing ethnic populations with self-reported census data is
problematic and cautioned against.
Table 2.3.3 RMS Ethnicity Categories, NBPD.
Race Category
Hispanic Origin
Not of Hispanic Origin
Unknown
Race and ethnicity are provided in this report by the cross-tabulation of race and ethnicity.
4. Arrest Calculations
All arrest calculations are made excluding protective custodies.
5. Calls For Service
In New Bedford, Calls For Service (CFS) represent all non-administrative calls, from all call sources. Both
calls initiated by a member of the public, through telephone or walk-ins, and calls that are officer initiated
are included. Calls are not differentiated by whether or not an officer is listed as being dispatched, as
some calls, for example when a desk officer investigates a walk-in complaint, are built without a unit
‘dispatched’ to the call.
6. Mapping
Incidents in the maps included in this document are each represented by a dot/point. In the instance of
multiple incidents at a given address, the dots will appear as one, ‘stacked’ on each other. As such, the
number of dots/points on a graph may not add to the number of incidents reported.

New Bedford Police Department, Annual Report, 2022 | 5
3. Overview
As defined by the FBI’s Uniform Crime Reporting Program, part A violent crimes consist of murder (09A),
rape (11A-D), robbery (120) and aggravated assault (13A). Arson (100), burglary (220), larceny (23A-H),
and motor vehicle theft (240) make up the part A property crime category. Table 3.1 shows the crime
totals.
Between 2013 and 2022 violent crime incidents in New Bedford decreased by 36%, from 990 to 634
incidents. Robbery incidents decreased 57%, rape incidents decreased by 13% and aggravated assaults
decreased by 33%. Property crime decreased by 53%, with a 77% decrease in burglaries, a 46% decrease
in larcenies and a 43% decrease in motor vehicle theft. Arson also decreased, by 52%.
Table 3.1: Part A Crimes, New Bedford, Ma, 2021-2022.
Crime
2013
2022
% Change
Violent
2
:
990
634
-36%
Murder (09A)
6
4
-33%
Rape (11A-D)
136
118
-13%
Robbery (120)
262
112
-57%
Aggravated Assault (13A)
637
429
-33%
Property
2
:
3,503
1,640
-53%
Arson (100)
27
13
-52%
Burglary (220)
923
215
-77%
Larceny (23A-H)
2,330
1,257
-46%
Motor Vehicle Theft (240)
353
202
-43%
Total:
4,425
2,238
-49%
2
Due to incidents having multiple offense categories, the number of incidents in each category do not sum to the
totals. For violent crime the difference is largely due to the number of robberies that also include an aggravated
assault offense and are thus counted in each category in this report, but only once to the total.

6 | New Bedford Police Department, Annual Report, 2022
4. Homicide
In 2022, there were four reported homicides in the city of New Bedford, MA, each of a single victim. This
was an increase of one from 2018, as represented in Figure 4.1. Arrests have been made in all four cases.
Figure 4.1: Homicide (NIBRS 09A) Incidents, New Bedford, MA, 2018-2022.
Firearms were the most common weapon used in homicides in 2022 and were used in three of the four
incidents. Personal weapons, that is hands or feet, were used in one homicide.
Table 4.1 Weapon used in homicides, 2022, New Bedford.
Weapon Used
Count
Firearm
3
Knife
0
Personal Weapons (Hands/Feet)
1

New Bedford Police Department, Annual Report, 2022 | 7
Figure 4.2: Map of Homicides, New Bedford, MA, 2022

8 | New Bedford Police Department, Annual Report, 2022
5. Sexual Assault
The number of reported sexual assault incidents in 2022 is 3% below 2018’s 122 incidents.
Figure 5.1: Sexual Assault (NIBRS 11A-D) incidents, New Bedford, MA, 2022.

New Bedford Police Department, Annual Report, 2022 | 9
6. Robbery
The number of robbery incidents reported in New Bedford in 2022 was 112, a decrease of 60 (34%) from
2018, when there were 172 robberies reported. Of the 112 robberies, 57 were armed robberies and 55
unarmed robberies.
Of note, there were two robbery series identified in 2022. One was a series of at least eight person-on-
person robberies, and the other was a series of seven commercial robberies.
Figure 6.1: Robbery (NIBRS 120) Incidents, New Bedford, MA, 2022.
Firearms were reported as having been used in 33 of the 112 robberies in 2022. Knives used in 16
robberies. Blunt objects were used in five robberies and pepper spray were used in two.
Table 6.1: Weapons Used in Robberies, New Bedford, MA, 2022.
Weapon
Count
Firearm
33
Knife
16
Blunt Object
5
Pepper Spray
2
Unknown
1
There were 95 person-on-person robberies in New Bedford in 2022. There were 17 commercial robberies.
Table 6.2: Robberies by Type, New Bedford, MA, 2022.
Type
Count
Person
95
Commercial
17

10 | New Bedford Police Department, Annual Report, 2022
Figure 6.2: Map of Robberies, New Bedford, MA, 2022

New Bedford Police Department, Annual Report, 2022 | 11
7. Assault
1. Aggravated Assaults
The number of incidents containing an aggravated assault offense in New Bedford in 2022 totaled 429, a
19% increase from 2018, when there were 361 aggravated assault incidents reported. As shown in Section
16, the proportion of aggravated assaults incidents in 2022 that were domestic involved was 42%.
Figure 7.1.1: Aggravated Assault (NIBRS 13A) Incidents, New Bedford, MA, 2018 - 2022.
Across the year, the most aggravated assaults took place in the hour between 6pm and 7pm, with 37
aggravated assaults during this hour of the day. The most aggravated assaults took place on a Saturday,
with 79 aggravated assaults. Friday was the second busiest, with 70 incidents. Wednesdays had the fewest
aggravated assaults reported, with 48.
Friday, between 9pm and 10pm, was the highest single hour of the week with 11 aggravated assaults
taking place during this hour of the week. This was followed by Mondays between 6pm and 7pm, with 8.
The least busy hours were generally between 5 and 8am.
Table 7.1.1: Aggravated Assaults by Time of Day, Day of Week, New Bedford, MA, 2022.
Hour of the Day
00
01
02
03
04
05
06
07
08
09
10
11
12
13
14
15
16
17
18
19
20
21
22
23
Total
Day of the Week
Mon
2
3
2
0
2
0
0
0
0
1
3
4
4
4
2
1
6
5
8
1
3
7
0
1
59
Tue
1
3
3
1
1
1
0
0
1
3
2
1
3
1
2
4
3
5
7
3
3
2
4
4
58
Wed
2
2
2
0
0
1
0
0
1
2
4
1
2
2
1
3
4
2
2
4
4
1
5
3
48
Thu
2
1
2
2
0
0
0
0
3
0
2
2
2
4
2
2
2
6
7
7
2
4
5
4
61
Fri
5
1
0
1
1
0
2
1
2
2
2
3
3
3
2
7
1
7
3
2
3
11
3
5
70
Sat
4
3
5
3
2
1
0
2
2
2
4
6
1
1
4
1
3
6
5
4
3
7
4
6
79
Sun
4
1
5
3
3
1
1
1
1
4
1
0
2
5
1
3
2
3
4
0
0
5
2
2
54
Total
20
14
19
10
9
4
3
4
10
14
18
17
17
20
14
21
21
34
36
21
18
37
23
25
429
The race and ethnicity of aggravated assault victims in 2022 is provided in table 7.1.2 below. The
proportion of aggravated assault victims who are listed as white is 72.4%, with 50.4% white not Hispanic

12 | New Bedford Police Department, Annual Report, 2022
and 20.2% white Hispanic. The proportion of aggravated assault victims who are listed as black is 25.7%,
with 20.0% black not Hispanic and 4.7% black Hispanic.
Table 7.1.2: Race and Ethnicity of Aggravated Assault (NIBRS 13A) Victims, New Bedford, MA, 2022.
Race
Ethnicity
Not
Hispanic
Hispanic
Unknown
Total
Asian
<1%
<1%
<1%
<1%
Black
20.0%
4.7%
1.0 %
25.7%
American
Indian/Alaskan Native
<1%
<1%
<1%
<1%
Hawaiian or Other
Pacific Islander
<1%
<1%
<1%
<1%
White
50.4%
20.2%
1.8%
72.4%
Unknown
<1%
<1%
1.2%
1.4%
Total
70.8%
25.3%
3.9%
100%
As shown in Table 7.1.3, males were the victims of a majority of aggravated assaults (56.8%), with females
representing 42.6% of victims of aggravated assault.
Table 7.1.3: Sex of Aggravated Assault Victims, New Bedford, MA, 2022.
Sex
Count
Female
42.6%
Male
56.8%
Unknown
<1%
Total
100%
Looking at the age of victims of aggravated assault, those aged between 25 and 29 years (inclusive) were
the largest age group. This group was followed by 20-24-year-olds as the second largest age group.

New Bedford Police Department, Annual Report, 2022 | 13
Figure 7.1.2: Age of Aggravated Assault Victims, New Bedford, MA, 2022.
2. Simple Assaults
The number of simple assault incidents reported in New Bedford totaled 1,453 in 2022, a decrease of 371
incidents (20%) from 1,824 incidents in 2018. As shown in Section 16, 57% of simple assaults were
domestic involved.
Figure 7.2.1: Simple Assault (NIBRS 13B) Incidents, New Bedford, MA, 2018 - 2022.
As shown in table 7.2.1, simple assaults most frequently took place on Fridays (233), with Saturday second
most common day of the week (222). Wednesday and Thursdays had the fewest simple assault incidents
(183 and 187 respectively). The busiest hour of the day was 6-7pm, 7-8pm second busiest and 6-8am the
two least busy hours of the day. Friday between 9-10pm was the busiest hour of the week, with 24
incidents.

14 | New Bedford Police Department, Annual Report, 2022
Table 7.2.1: Simple Assaults by Time of Day, Day of Week, New Bedford, MA, 2022.
Hour of the Day
00
01
02
03
04
05
06
07
08
09
10
11
12
13
14
15
16
17
18
19
20
21
22
23
Total
Day Of Week
Mon
9
13
8
4
3
2
4
3
9
13
11
9
9
11
8
6
8
13
7
13
13
16
12
6
210
Tue
3
5
4
5
2
1
2
0
11
16
8
10
12
10
14
9
8
10
18
11
16
8
9
8
200
Wed
8
2
6
4
2
2
0
6
5
9
13
9
7
12
18
6
6
10
15
18
3
10
8
4
183
Thu
6
6
5
1
4
6
2
4
5
7
9
9
7
13
13
11
12
5
8
9
18
8
8
11
187
Fri
4
7
6
4
3
2
2
3
7
8
4
4
13
12
10
12
20
13
20
7
13
24
21
14
233
Sat
6
7
11
6
7
3
5
3
1
10
9
10
9
8
10
13
11
11
12
17
13
11
16
13
222
Sun
12
11
16
14
3
5
3
0
4
9
12
10
5
6
5
10
9
9
19
14
12
8
8
14
218
Total
48
51
56
38
24
21
18
19
42
72
66
61
62
72
78
67
74
71
99
89
88
85
82
70
1,453
The race and ethnicity of simple assault victims in 2022 is provided in table 7.2.2 below. The proportion
of simple assault victims who are listed as white is 73.3%, with 53.1% white non-Hispanic and 18.1% white
Hispanic. The proportion of simple assault victims who are listed as black is 24.3%, with 17.0% black non-
Hispanic and 6.1% black Hispanic.
Table 7.2.2: Race and Ethnicity of Simple Assault (NIBRS 13B) Victims, New Bedford, MA, 2022.
Race
Ethnicity
Hispanic
Non-
Hispanic
Unknown
Total
Asian
<1%
<1%
<1%
<1%
Black
6.1%
17.0%
1.1%
24.3%
American
Indian/Alaskan Native
<1%
<1%
<1%
<1%
Hawaiian or Other
Pacific Islander
<1%
<1%
<1%
<1%
White
18.1%
53.1%
2.2%
73.3%
Unknown
1.00%
<1%
<1%
1.8%
Total
25.4%
70.5%
4.1%
100%
As shown in Table 7.2.3, the proportion of simple assault victims that were male was 43%, with females
representing the remaining 57% of victims. This proportion is the reverse of aggravated assaults, where
male victims make up the majority of victims.
Table 7.2.3: Sex of Simple Assault Victims, New Bedford, MA, 2022.
Sex
Count
Female
57%
Male
43%
Unknown
<1%
Total
100%

New Bedford Police Department, Annual Report, 2022 | 15
8. Burglary/B&E
In 2022 there were 215 burglary/B&E incidents in New Bedford, as defined by the NIBRs 220 category
3
,
‘the unlawful entry into a building or other structure with the intent to commit a felony or a theft.’ This
was a decrease of 291 incidents (57%) from 2018, when there were 506 incidents.
Figure 8.1: Burglary/B&E (NIBRS 220) Incidents, New Bedford, MA, 2018 - 2022.
When considering burglaries/B&Es by month, June and August were the highest, with 25 incidents each.
January and December the lowest months for burglary/B&Es, with 11 incidents each.
Figure 8.1: Burglary/B&E (NIBRS 220) Incidents, New Bedford, MA, 2022.
3
Per NIBRS, B&E into motor vehicle is contained within larcenies.

16 | New Bedford Police Department, Annual Report, 2022
9. Larceny
There were 1,257 larcenies
4
reported in New Bedford in 2022, a decrease of 587 incidents (32%) from the
1,844 reported in 2018, having remained relatively flat since 2020.
Figure 9.1: Larceny (NIBRS 23A-H) Incidents, New Bedford, MA, 2018-2022.
By month, August was the busiest month of the year for larcenies, with 127 incidents, followed by June
with 125. November and January, with 64 and 75 incidents respectively, had the fewest incidents.
Figure 9.2: Larceny (NIBRS 23A-H) Incidents, New Bedford, MA, 2022.
4
As defined by the NIBRs 23A-H categories

New Bedford Police Department, Annual Report, 2022 | 17
1. Catalytic Converters
There was a significant increase in catalytic converter thefts reported in New Bedford in 2022, following
national trends associated with the increase in price of platinum-group metals. In 2022 there were 95
incidents of catalytic converter theft reported, an increase of 90 (1800%) on the five larcenies of catalytic
converters in 2018.
With incidents where multiple vehicles were targeted and the number of catalytic converters on vehicles
varying depending on the specific vehicle model, the number of catalytic converters stolen in 2022
exceeds the number of incidents reported.
Figure 9.1.1: Catalytic Converter Theft Incidents, New Bedford, MA, 2018-2022.

18 | New Bedford Police Department, Annual Report, 2022
10. Arson
In 2022 there were 13 arson incidents (NIBRS 240) reported to the New Bedford Police Department, a
decrease of 7 incidents (35%) from the 20 arson incidents reported in 2018. A map of arsons can be found
in Figure 10.2.
Figure 10.1: Arson Incidents, New Bedford, MA, 2018 - 2022.
The geographic distribution of arsons in New Bedford in 2022 is provided on the following page in figure
10.1.

New Bedford Police Department, Annual Report, 2022 | 19
Fig 10.2: Map of Arson Incidents, New Bedford, MA, 2022.

20 | New Bedford Police Department, Annual Report, 2022
11. Motor Vehicle Theft
In 2022 there were 202 motor vehicle theft (NIBRS 240) incidents reported in the city of New Bedford.
There has been an increase of 14 incidents (7%) from 2018 when there were 188 thefts. By month, motor
vehicle thefts trended upwards through July, before trending downwards through December. With three
dirt bikes being taken in one incident, a total of 205 vehicles were stolen in 2022.
Figure 11.1 MV Theft (NIBRS 240) Incidents, New Bedford, MA, 2018 - 2022.
Figure 11.2 MV Theft Incidents (NIBRS 240) by Month, New Bedford, MA, 2022.

New Bedford Police Department, Annual Report, 2022 | 21
Per NIBRs definitions, all land based motorized vehicles (that do not run on rails) are included in the stolen
motor vehicle category. As such, scooters, mopeds and recreational vehicles, which represent 36 (18%) of
the 205 vehicles stolen in New Bedford in 2022, are included in this category.
Table 11.1: Vehicles Stolen by Vehicle Type, New Bedford, MA, 2022.
Type
Count
Dirt Bike
7
Scooter/Moped
20
Motorcycle
9
Unknown
1
All Others
168
Total
205
Excluding bikes, scooters and mopeds, Toyota, Honda, Ford, Nissan and Chevrolet vehicles were the top
five stolen vehicles in New Bedford in 2022. Hyundais and Kias, popularized nationally by a TikTok
challenge, were seventh and tenth most stolen vehicles in New Bedford in 2022.
Reflecting their prevalence on the road, Toyota Camrys and Honda Civics were the two most stolen vehicle
models in New Bedford in 2022. They were followed by Honda Accords, Nissan Altimas, Toyota Corollas
and Honda Pilots.
Table 11.2: Top Five Makes Stolen, New Bedford,
MA, 2022.
Make
Count.
1
Toyota
27
2
Honda
24
3
Ford
21
4
Nissan
14
5
Chevrolet
12
Table 11.3: Top Five Models Stolen, New
Bedford, MA, 2022.
Make
Model
Count.
1
Toyota
Camry
9
2
Honda
Civic
7
3=
Honda
Accord
6
3=
Nissan
Altima
6
5=
Toyota
Corolla
5
5=
Honda
Pilot
5
When considering the age of vehicles stolen, 2014 model year vehicles were the most stolen vehicles in
New Bedford in 2022, with 13 vehicles stolen. 2014 model year vehicles were followed by 2008 and 2009
vehicles, with 10 taken each.

22 | New Bedford Police Department, Annual Report, 2022
Figure 11.3: Vehicle Stolen by Model Year, New Bedford, MA, 2022.
The geographic distribution of motor vehicle thefts in New Bedford in 2022 is provided on the following
page in figure 11.4.

New Bedford Police Department, Annual Report, 2022 | 23
Figure 11.4 Map of Motor vehicle Theft

24 | New Bedford Police Department, Annual Report, 2022
12. Arrests
The New Bedford Police Department made 2,523 arrests
5
in 2022. Arrests in 2022 were 27% lower than
in 2018, when 3,442 arrests were made by the New Bedford Police Department.
Looking by month, arrests were generally higher during the middle of the year. Arrests trended up over
the first 9 months of the year, from 164 in February to a peak in September when 252 arrests were made.
Arrests then declined through December.
Figure 12.1 Arrest by Year, New Bedford, MA, 2018-2022.
Figure 12.2 Arrest by Month, New Bedford, MA, 2022.
Arrestees were charged with a felony offense in 580 of the 2,523 arrests made by the New Bedford Police
Department in 2022, with a further 1,039 arrestees charged with a misdemeanor charge. The remaining
904 arrestees were charged with ordinance violations or arrested on an active warrant.
As shown in Figure 12.1, Fridays were the busiest day for arrests by the New Bedford Police Department,
with 410 arrests made on a Friday in 2022, followed by Saturdays with 380 arrests made. The fewest
arrests were made on Sundays, with 268 arrests made. Arrests were generally lowest between the hours
of 4 am and 9am, and highest between the hours of 5pm and 11pm. While the most arrests were made
5
All arrests figures exclude protective custodies.

New Bedford Police Department, Annual Report, 2022 | 25
between the hours of 6pm and 7pm, with 223 arrests made in 2022, the busiest single hour of the week
was Friday between 9pm and 10pm, with 45 arrests.
Table 12.1: Arrests by Time of Day, Day of Week, New Bedford, MA, 2022.
Hour of the Day
00
01
02
03
04
05
06
07
08
09
10
11
12
13
14
15
16
17
18
19
20
21
22
23
Total
Day of the Week
Mon
8
16
11
10
4
2
5
4
4
3
9
14
13
36
24
22
13
24
32
24
26
29
23
5
361
Tue
9
14
12
8
2
5
3
7
4
15
13
6
11
19
32
22
13
31
36
33
21
17
20
15
368
Wed
9
16
4
3
5
0
2
4
5
8
17
12
19
27
34
31
22
20
35
31
18
22
20
13
377
Thu
13
16
14
7
3
3
3
3
0
8
14
6
11
18
31
13
19
34
37
36
16
23
19
12
359
Fri
4
9
12
9
5
2
3
3
5
6
5
14
10
21
27
24
29
35
42
31
27
45
26
16
410
Sat
10
21
25
17
9
6
2
6
4
13
25
24
17
17
21
25
13
15
19
22
19
20
22
8
380
Sun
11
19
21
17
4
7
6
1
5
5
10
11
6
6
9
6
8
26
22
18
12
12
14
12
268
Total
64
111
99
71
32
25
24
28
27
58
93
87
87
144
178
143
117
185
223
195
139
168
144
81
2,523
1. Arrest Demographics
Offenders recorded in the department’s Record Management System as white represented 68% of the
individuals arrested, with white not Hispanic representing 47% of arrested individuals and white Hispanics
representing 18%. Individuals recorded as black represented 30% of all arrests, with 22% black not
Hispanic and 8% black Hispanic. Overall, 70% of arrestees are recorded as being not Hispanic, with 27%
recorded as Hispanic. The breakdown is provided below in Table 12.1.1 and in Figure 12.1.1:
Table 12.1.1: Race and Ethnicity of Individuals Arrested, New Bedford, MA, 2022
Race
Ethnicity
Not
Hispanic
Hispanic
Unknown
Total
Asian
<1%
<1%
0%
<1%
Black
21.8%
7.5%
0.8%
30.1%
American
Indian/Alaskan Native
0%
<1%
0%
<1%
Hawaiian or Other
Pacific Islander
0%
<1%
0%
<1%
White
47.3%
18.5%
1.9%
67.6%
Unknown
<1%
<1%
1%
1.9%
Total
67.6%
26.9%
3.6%
100%

26 | New Bedford Police Department, Annual Report, 2022
Figure 12.1.1: Race and Ethnicity of Individuals Arrested, New Bedford 2022
2. Arrests By Age Group
When breaking down arrests by the age of individuals arrested, 30- to 34-year-olds (inclusive) represented
the largest age group in 2022, with 428 arrests. The second highest group were 25- to 29-year-olds (407
arrests), followed by 35- to 39-year-olds (387 arrests). Half of all individuals arrested were between 27
years old and 43 years old. 44 of the 2,523 (2%) individuals arrested by the New Bedford Police
Department in 2022 were juveniles aged under 18.
Figure 12.2.1 Arrests by Age Group, New Bedford, MA, 2022
3. Arrests By Sex
The proportion of arrestees who are recorded as male in the department’s RMS is 75%, with females
representing 25% of arrestees.

New Bedford Police Department, Annual Report, 2022 | 27
Table 12.3.1: Sex of Individuals Arrested, New Bedford, MA, 2022.
Sex
Prop.
Female
25%
Male
75%
Total
100%
4. Juvenile Arrests
Juvenile arrets
6
by the New Bedford Police Department trended downwards between 2018 and 2022, with
44 juveniles arrested in New Bedford in 2022. The number of juvenile arrests in 2022 was 59% lower than
in 2018, when 108 juveniles were arrested. Felony offenses comprised 15 of the 44 arrests, a similar
proportion to that of juvenile arrests made in 2018 (37 out of the 108).
Figure 12.4.1: Juvenile Arrests, New Bedford, MA, 2018-2022.
5. Firearm Arrests & Seizures
In 2022, the New Bedford Police Department made 34 firearms arrests. In total the New Bedford Police
Department seized 58 firearms
7
,
8
. Of these 58 firearms, eight were ghost guns, eight had defaced serials
and nine were unattended or ‘block’ guns.
Table 12.5.1: Firearms Seized, New Bedford, MA, 2022
Category
Count
Firearms Seized
58
Ghost Guns
8
Defaced Serial Guns
8
Unattended/Block Guns
9
6
Individuals under 18 years of age.
7
Defined as illegally possessed or unattended (block) firearms. Held for safekeeping and surrendered excluded.
8
Eight firearms were seized as part of a joint operation.

28 | New Bedford Police Department, Annual Report, 2022
6. Drug Arrests
There were 434 drug arrests
9
made by the New Bedford Police Department in 2022. This was 17 fewer
arrests than the 451 drug arrests made in 2018, a decrease of 4%.
Figure 12.6.1: Drug Arrests, New Bedford, MA, 2018-2022.
As shown in Figure 12.6.2 below, drug arrests in New Bedford fluctuated by month during 2022. The most
(53) arrests were made in June and the fewest (20) were made two months later in August.
Figure 12.6.2: Drug Arrests by Month, New Bedford, MA, 2022.
9
Defined as arrests containing a NIBRS 35A charge.

New Bedford Police Department, Annual Report, 2022 | 29
13. Shots Fired
There were 49 confirmed shots-fired in New Bedford in 2022 a decrease of two incidents, (4%), from 2018
when there were 51 confirmed incidents. Of these 49 shots-fired incidents, three were fatal, four resulted
in the injury of a total of five victims and 30 resulted in property damage. In 16 cases there was no property
damage, injuries or fatalities, with other evidence such as shell casings or CCTV footage confirming the
incident.
Figure 13.1 Confirmed Shots-Fired Incidents, New Bedford, MA, 2018-2022
Table 13.1 2022 Shots Fired Incidents, New Bedford, MA, 2022
Shots-Fired Category
Count
Fatal
3
Non-Fatal
4 (5 victims)
Property Damage
30
Other
16
Total Confirmed Shots Fired
10
49
Shots-fired incidents were higher in the summer months of 2022, peaking in July, with 10 confirmed
incidents. The July peak was followed by the first August since at least 2016 in which no shots-fired
incidents were confirmed.
10
Shots fired incidents may occupy multiple categories. Self-inflicted, accidental discharge and justifiable
discharge are excluded.

30 | New Bedford Police Department, Annual Report, 2022
Figure 13.2 Confirmed Shots-Fired incidents by Month, New Bedford, MA, 2022:
In 2022, confirmed shots-fired incidents were most likely to occur between the hours of 9pm and 3am,
with approximately two thirds of all incidents occurring within this six-hour period. The hour of the day
with the highest volume was between 9pm and 10pm, with seven incidents and 2am to 3am the second
busiest hour of the day with six incidents. Sundays were the busiest day, with 10 confirmed shots-fired
incidents, followed by Saturdays with 9, including the busiest hour of the week, Saturdays between 2am
and 3am (3 incidents).
Table 13.2 Confirmed Shots Fired by Time of Day/Day of Week, New Bedford, MA, 2022
Hour of Day
0
1
2
3
4
5
6
7
8
9
10
11
12
13
14
15
16
17
18
19
20
21
22
23
Total
Day Of Week
Mon
0
1
1
0
0
0
0
0
0
0
0
0
1
0
1
0
0
0
1
0
1
2
0
0
8
Tue
0
0
0
0
0
0
0
0
0
0
0
0
0
0
1
1
1
0
1
1
0
0
1
0
6
Wed
2
1
0
0
0
0
0
0
0
0
0
0
0
0
0
0
0
0
1
0
0
1
0
1
6
Thu
1
0
1
0
0
0
0
0
0
0
0
0
0
0
0
0
0
0
0
0
0
1
2
2
7
Fri
1
2
0
0
0
0
0
0
0
0
0
0
0
0
0
0
0
0
0
0
0
0
0
0
3
Sat
1
0
3
0
0
0
0
0
0
0
1
0
0
1
0
0
0
0
0
0
1
1
0
1
9
Sun
0
1
1
1
1
0
0
0
0
0
0
0
1
0
0
1
0
0
0
0
0
2
2
0
10
Total
5
5
6
1
1
0
0
0
0
0
1
0
2
1
2
2
1
0
3
1
2
7
5
4
49
The geographic distribution of all confirmed shots-fired are presented in Figure 13.3 on the following page.

New Bedford Police Department, Annual Report, 2022 | 31
Figure 13.3: Map of Shots-Fired, New Bedford, MA, 2022

32 | New Bedford Police Department, Annual Report, 2022
14. Calls for Service
In this report, Calls For Service (CFS) represent all non-administrative calls, from all call sources. As such,
calls that are officer initiated or initiated by a member of the public through telephone or walk-ins are
included. There were 79,238 calls for service in New Bedford in 2022, a decrease of 14,264 calls (15%)
from 2018, when there were 93,502 calls for service.
Figure 14.1: Call For Service, New Bedford, MA, 2018-2022
Table 14.1, Figure 14.2 and Figure 14.3 cover call volumes across the week. Fridays were the busiest day
of the week, with 12,058 calls on a Friday in 2022, while Sunday was the least busy, with 10,391 calls. The
busiest hour of the day was 4-5pm, with 4,852 calls, followed by 5-6pm, with 4,762 calls. Calls were lowest
between 3-6am. The busiest hour of the week was Tuesday between 4-5pm.
Table 14.1: Call For Service, by Day of Week and Time of Day, New Bedford, MA, 2022
Hour of the Day
00
01
02
03
04
05
06
07
08
09
10
11
12
13
14
15
16
17
18
19
20
21
22
23
Total
Day of the Week
Mon
305
240
205
143
167
168
299
390
503
589
623
658
621
690
686
647
718
645
594
579
529
456
387
279
11,121
Tue
281
241
195
156
160
159
286
369
583
601
686
670
676
670
704
621
743
739
659
585
572
463
405
280
11,504
Wed
280
223
191
137
154
178
281
431
493
563
695
688
666
637
677
658
700
713
635
618
519
480
391
290
11,298
Thu
314
249
241
156
150
161
269
372
548
565
629
707
586
616
682
649
701
723
649
552
505
527
468
365
11,384
Fri
397
307
254
192
167
215
298
362
485
577
610
603
658
628
663
691
739
743
697
635
599
565
549
424
12,058
Sat
440
454
436
259
205
185
246
309
383
498
608
603
606
566
532
572
630
622
610
577
558
581
554
448
11,482
Sun
459
413
425
283
213
175
238
243
383
467
535
524
539
518
539
490
621
577
526
540
500
490
396
297
10,391
Total
2,476
2,127
1,947
1,326
1,216
1,241
1,917
2,476
3,378
3,860
4,386
4,453
4,352
4,325
4,483
4,328
4,852
4,762
4,370
4,086
3,782
3,562
3,150
2,383
79,238

New Bedford Police Department, Annual Report, 2022 | 33
Figure 14.2: Calls For Service By Hour of the Day, New Bedford, Ma, 2022
Figure 14.3: Calls For Service By Hour of the Day, New Bedford, Ma, 2022
1. Call Reasons
When looking at the top ten call reasons, as shown in Table 14.1.1, disturbance and complaint calls
represent the two most frequent call reasons in 2022, with 9,820 and 6,772 calls respectively. Disturbance
calls decreased by 4,371 (31%) from 2018, while complaint calls decreased by 341 calls (5%). Of the top
ten call reasons in 2022, check welfare calls made the largest increase both in the total number of calls
(+1529) and percentage (+35%). Domestic disturbance calls increased 15%, from 2,590 to 2994 calls
between 2018 and 2022.

34 | New Bedford Police Department, Annual Report, 2022
Table 14.1.1: Top 10 Call Reasons, New Bedford, MA, 2021-2022.
Call Reason
2018
Call Reason
2022
Disturbance
14,191
Disturbance
9,820
Traffic Stop
9,310
Complaint
6,772
Complaint
7,113
Check Welfare
5,858
Check Auto
6,764
Sick Person
5,589
Alarm, Burglar
5,523
Check Auto
5,108
Motor Vehicle Accident
5,037
Motor Vehicle Accident
4,457
Sick Person
4,842
Traffic Stop
3,666
Check Welfare
4,329
Animal Control
3,604
Animal Control
3,070
Alarm, Burglar
3,433
Domestic Disturbance
2,590
Domestic Disturbance
2,994

New Bedford Police Department, Annual Report, 2022 | 35
15. Mental Health
The New Bedford Police Department has a number of programs providing a co-response capability, with
clinicians from partner agencies embedded with officers. The co-response units are available to respond
to calls with a mental health component as well as initiate follow-up and check welfare calls.
1. MH1
MH1 is a unit funded through an annual grant from the Department of Mental Health. Starting in May
2022, with five evening shifts a week, increasing to 10 shifts a week in August, the MH1 unit identified
720 individuals for visits, with a clinician present on 75% of shifts.
Figure 15.1: MH1 individuals Identified for Visits, New Bedford, MA, 2022,
2. Co-Response Clinician (Child & Family Services, Inc.)
The New Bedford Police Department and Child and Family Services, INC. Emergency Services Program
(ESP) co-response program made 283 direct interactions and 40 indirect interactions in 2022. 52% of
clients directly interacted with were diverted from going to the Emergency Department and ESP co-
response issued 70 Section 12’s following direct interactions.

36 | New Bedford Police Department, Annual Report, 2022
16. Domestic Violence
1. Domestic Verbal Arguments
The New Bedford Police Department responded to 2,126 domestic verbal argument (DVA) incidents in
2022, a decrease of 78 incidents (4%) from 2018 when there were 2,204 DVA incidents.
Figure 16.1.1: Domestic Verbal Arguments, New Bedford, MA, 2018-2022
When considering domestic verbal arguments by the time of day and day of the week, the highest number
of domestic verbal arguments (151) took place between 8 and 9pm, followed by 146 between 7 and 8pm.
Saturday and Sunday were the most common days for a domestic verbal argument to be reported, with
342 each. The busiest single hour of the week was Tuesdays between 8 and 9pm.
Table 16.1.1: Domestic Verbal Arguments by Time of Day, Day of Week, New Bedford, MA, 2022
Hour of the Day
00
01
02
03
04
05
06
07
08
09
10
11
12
13
14
15
16
17
18
19
20
21
22
23
Total
Day Of the Week
Mon
10
12
8
8
2
1
6
7
9
7
14
8
17
15
15
14
19
13
25
21
26
18
24
16
315
Tue
9
10
7
8
1
2
1
4
8
8
4
17
11
14
10
17
18
18
22
24
31
19
18
13
294
Wed
12
8
4
5
2
4
11
3
13
8
8
10
16
11
9
13
17
19
18
19
17
18
13
10
268
Thu
13
7
5
2
5
1
4
8
13
10
9
8
15
10
11
9
15
20
14
25
19
22
18
17
280
Fri
7
11
9
6
5
5
7
4
8
11
11
8
11
5
12
20
18
15
20
19
14
16
20
23
285
Sat
18
23
20
7
9
8
5
4
8
13
16
13
13
9
8
18
20
19
17
17
23
13
20
21
342
Sun
17
14
13
15
8
6
2
6
8
11
9
15
13
16
24
11
22
21
17
21
21
20
19
13
342
Total
86
85
66
51
32
27
36
36
67
68
71
79
96
80
89
102
129
125
133
146
151
126
132
113
2126
2. Domestic Assaults
Domestic assaults comprised a significant proportion of assaults reported to the New Bedford Police
Department in 2022, with 1,017 of the 1,882 (54%) assault incidents determined to be domestic involved.
When comparing simple and aggravated domestic assaults
11
, a majority of simple assault incidents were
domestic involved, while domestic involved incidents accounted for a minority of the aggravated assaults.
11
Per NIBRS 13A and 13B definitions.

New Bedford Police Department, Annual Report, 2022 | 37
Specifically, 58% of simple assault incidents were domestic involved, while 42% of aggravated assault were
domestic involved.
Figure 16.2.1: Assaults by Domestic and Aggravated Status, New Bedford, MA, 2022
As shown in Figure 16.2.2, the domestic assault incidents most frequently took on the weekend, with 155
on Sundays and 148 on Saturdays, and the fewest took place mid-week, with 111 on Wednesdays and 113
on Thursdays.
Table 16.2.1: Domestic Assault by Time of Day, Day of Week, New Bedford, MA, 2022.
Hour of the Day
00
01
02
03
04
05
06
07
08
09
10
11
12
13
14
15
16
17
18
19
20
21
22
23
Total
Day Of Week
Mon
6
9
8
4
2
2
2
2
8
6
6
5
6
6
4
6
5
9
6
8
6
10
6
5
137
Tue
3
6
4
3
2
1
1
0
7
9
5
7
4
6
5
5
6
7
10
7
10
6
8
6
128
Wed
8
3
5
1
1
1
0
2
4
4
6
3
2
5
5
4
6
9
11
12
2
7
7
3
111
Thu
7
5
5
1
3
3
1
3
2
4
3
6
1
7
4
8
6
5
5
5
11
7
6
5
113
Fri
4
4
3
3
1
0
1
2
4
3
4
3
3
6
8
5
12
11
14
5
8
16
14
11
145
Sat
3
6
6
4
7
4
2
1
2
7
7
6
7
5
7
7
6
6
8
15
6
8
11
7
148
Sun
7
8
11
8
3
5
4
1
3
5
11
7
5
6
1
9
7
4
13
8
9
6
6
8
155
Total
38
41
42
24
19
16
11
11
30
38
42
37
28
41
34
44
48
51
67
60
52
60
58
45
937
Evenings between 6 and 7pm were the busiest hour of the day for domestic assaults, with 67 incidents,
while Fridays between 9 and 10pm was the single busiest hour across the week. In general, the pattern
across the day and week resembled domestic verbal arguments and overall assaults.
The victims of domestic assault were predominantly female, with 68% of victims female. This contrasts
with non-domestic assaults, where the majority (60%) of victims were male.

38 | New Bedford Police Department, Annual Report, 2022
Figure 16.2.2: Sex of Victim, Domestic and Non-Domestic Assault, New Bedford, MA, 2022
Domestic
Not
Domestic
Male
32%
60%
Female
68%
40%
Total
100%
100%
When examined alongside the victims of domestic violence and simple vs. aggravated assaults, a pattern
emerges. Specifically, females are more likely to be the victim of domestic assault and these incidents are
more likely to be simple, rather than aggravated, assaults. On the other hand, males are more likely to be
the victim of non-domestic assaults and a higher percentage of these are aggravated assaults.

New Bedford Police Department, Annual Report, 2022 | 39
17. Overdoses
Fatal overdoses recorded by the New Bedford Police Department increased by 7 from 50 in 2019 to 57 in
2022, an increase of 14%.
Figure 17.1: Fatal Overdoses, New Bedford, MA, 2018-2022
There were 469 non-fatal overdoses recorded by the New Bedford Police Department in 2022. This was a
decrease of 15% from the 551 recorded in 2019.
Figure 17.2: Non-Fatal Overdoses, New Bedford, MA, 2018-2022
1. Demographics
Victims of overdoses were predominately male, with 44 (77%) of the 57 fatal overdose victims male, and
387 (69%) of the 334 non-fatal overdose victims
12
male. Females represented 23% of fatal overdoses and
31% of non-fatal overdose victims.
12
16% of overdose victims had multiple overdose incidents.

40 | New Bedford Police Department, Annual Report, 2022
Table 17.2: Fatal and Non-Fatal Overdose Victims by Sex, New Bedford, MA, 2022
Fatal
Non-Fatal
Male
77%
Male
69%
Female
23%
Female
31%
Total
100%
Total
100%
A majority, 71%, of fatal overdose victims in 2022 were White not Hispanic, with a further 11% White
Hispanic. The proportion of overdose victims in 2022 who were Black not Hispanic was 13%, with a further
5% Black Hispanic.
Table 17.3: Fatal Overdose Victims by Race and Ethnicity, New Bedford, MA, 2022
Race
Ethnicity
Not
Hispanic
Hispanic
Total
White
70%
9%
79%
Black
19%
2%
21%
Total
89%
11%
100%
The proportion of non-fatal overdose victims were White not Hispanic was 67%, with a further 12% White
Hispanic. The proportion of non-fatal overdose victims who were Black not Hispanic was 14%, with a
further 7% Black Hispanic. One percent of victims were entered as having some other race.
Table 17.4: Non-Fatal Overdose Victims by Race and Ethnicity, New Bedford, MA, 2022
Race
Ethnicity
Not
Hispanic
Hispanic
Unknown
Total
White
67%
12%
<1%
79%
Black
14%
7%
<1%
21%
Other
1%
<1%
<1%
1%
Unknown
<1%
<1%
<1%
<1%
Total
81%
19%
<1%
100%
Further overdose analysis can be found in the 2022 Annual Overdose & Outreach report.

New Bedford Police Department, Annual Report, 2022 | 41
18. Traffic
1. Traffic Stops
The New Bedford Police Department logged 3,666 traffic stops in 2022, a 61% decrease of 5,644 stops
from the 9,310 stops made in 2018.
Table 18.1.1: Traffic Stops, New Bedford, MA, 2018-2022
The details of a total of 1,332 operators were stored in the call data of traffic stops in 2022
13
. In half of all
calls where operator details were not recorded, the call was cleared ‘warned’. Of the 1,332 operators
whose details are stored in call data, a total of 68% had an unknown race and 71% had an unknown
ethnicity. 23% of operators whose details were stored were White, with 14% White not Hispanic and 7%
White Hispanic. 9% of entered operators were Black, with 7% Black not Hispanic and 2% Black Hispanic.
Table 18.1.1: Race and Ethnicity of Vehicle Operators in Traffic Stops, New Bedford, MA, 2022
Race
Ethnicity
Not
Hispanic
Hispanic
Unknown
Total
Asian
<1%
<1%
<1%
<1%
Black
7%
2%
1%
9%
American
Indian/Alaskan Native
<1%
<1%
<1%
<1%
Hawaiian or Other
Pacific Islander
<1%
<1%
<1%
<1%
White
14%
7%
2%
23%
Unknown
<1%
<1%
68%
68%
Total
20%
9%
71%
100%
13
The operator’s details may have been stored elsewhere, such as if a citation was subsequently issued.

42 | New Bedford Police Department, Annual Report, 2022
2. Citations
In total, 3,185
14
citations were issued by the New Bedford Police Department in 2022. This represents a
51% decrease from 2018, when 6,489 citations were issued. Of the 3,179 citations issued in 2022, 316 of
the issued citations were arrest, 283 were civil, 1,070 were criminal, 50 were municipal, 1,460 were
written warnings and nine were verbal warnings.
Figure 18.2.1: Citations by Type, New Bedford, MA, 2018-2022.
Table 18.2.1: Citations by Type, New Bedford, MA, 2022.
Citation Action
Count
Arrest
317
Civil
284
Criminal
1072
Municipal
43
Written Warning
1460
Verbal Warning
9
Total
3185
Of the 3,185 citations issued in 2022, 2,983 were issued to vehicle operators, with the remaining 202
issued to the vehicle owner. Vehicle operators were New Bedford residents in 75% of issued citations
(2,252 of the 2,983 operators), with 731 cited operators having addresses outside the city. Non-residents
cited by the New Bedford Police Department were most likely to be residents of towns and cities
surrounding New Bedford, with residents of Dartmouth, Fairhaven, Fall River and Acushnet accounting
for over half the non-residents cited (394 of the 731 non-residents).
14
50 citations were voided.

New Bedford Police Department, Annual Report, 2022 | 43
Table 18.2.2: Residency of Cited Operators, New Bedford, MA, 2022.
Residency
Count
New Bedford Resident
2,252
Non-New Bedford Resident
731
Total
2,983
White operators accounted for 65% of operators cited in New Bedford in 2022, with 38% White not
Hispanic and 18% White Hispanic. Black operators represented 20% of all operators cited, with 13% Black
not Hispanic and 5% Black Hispanic. The ethnicity of 23% of operators cited by the New Bedford Police
Department is recorded as unknown and the operator’s race is recorded as unknown in 15% of citations.
Table 18.2.3 Race and Ethnicity of Cited Operators, New Bedford, MA, 2022.
Race
Ethnicity
Not
Hispanic
Hispanic
Unknown
Total
Asian
<1%
<1%
<1%
<1%
Black
13%
5%
2%
20%
American
Indian/Alaskan Native
<1%
<1%
<1%
<1%
Hawaiian or Other
Pacific Islander
<1%
<1%
<1%
<1%
White
38%
18%
9%
65%
Unknown
<1%
3%
12%
15%
Total
51%
25%
23%
100%
Male operators represented 62% of all operators cited. Females represented 37% of operators, with one
percent of operator’s sex unknown.
Table 18.2.4: Sex of Cited Operators, New Bedford, MA, 2022.
Sex
Count
Female
37%
Male
62%
X
<1%
Blank
1%
Total
100%
44 | New Bedford Police Department, Annual Report, 2022
[This page is intentionally left blank]

New Bedford Police Department
871 Rockdale Avenue
New Bedford, MA 02740
Phone: 508-991-6300
Fax: 508-961-3022
NewBedfordPD.com
facebook.com/newbedfordpolice/
instagram.com/newbedfordpd/
twitter.com/NewBedfordPD
