
Flood Insurance & Coastal Risk Map Update
This presentation is to review the changes to flood insurance that went into effect last
October and to show the upcoming changes to our coastal risk flood maps that will
become effective on December 15, 2022.
1

BACKGROUND:
• National Flood Insurance Program (NFIP)
• Purposes of the NFIP
• Minimum requirements of the NFIP
• Charlotte County joined the NFIP in 1971
THE
NATIONAL
FLOOD
INSURANCE
PROGRAM
Background on the NFIP program.
• Congress created the NFIP through the National Flood Insurance Act of 1968
• This was created with two purposes.
First – to share the risk of flood losses through flood insurance and
Second – Reduce flood damages by restricting floodplain development
• Communities that join the NFIP are required to adopt the minimum requirements of the
NFIP. Once adopted, federal flood insurance and flood maps become available to the
community and t
heir citizens.
• Charlotte County received our first flood maps when we joined the NFIP in 1971.
• Charlotte County joined the voluntary Community Rating System (CRS) when it became
available in the early 1990s. Through floodplain management activities that exceed the
minimum standards of the NFIP, Charlotte County is currently a Class 6 community. This
classification provides a 20% discount for flood insurance premiums for flood insurance
policies through the NFIP.
• Charlotte County will improve to a Class 5 community on April 1, 2023. This will increase
the flood insurance discount for flood insurance from the NFIP from 20% to 25%.
2
• Mandatory flood insurance requirement
• Risk Rating 2.0
• Flood Insurance Rate Map (FIRM)
vs Risk Rating 2.0
• FIRM
THE
NATIONAL
FLOOD
INSURANCE
PROGRAM
• Homes that have a federally backed mortgage and are located in a SFHA are required to carry
flood insurance. Flood insurance is typically separate from homeowner’s insurance.
• Risk Rating 2.0 is the NFIP’s updated flood insurance method of pricing (rating). New policies
have been priced using this method since October 1, 2021. Other policies already in effect will
move to this method of pricing as they renew after April 1, 2022.
• Previously, flood insurance was priced/rated just using the flood insurance rate maps. You were
either in a high-risk flood zone or you weren’t and your insurance rates were based on that.
Risk Rating 2.0 is the first fundamental change to the way the NFIP prices flood insurance since
the 1970s. It now reflects an individual property’s risk, and reviews more types of flood risk in
rates, uses the latest actuarial practices to set risk-based rates, provide rates that are easier to
understand for agents and policyholders, and reduces the complexity for agents to generate a
flood insurance quote.
For policies that will see increases in their flood insurance, those increases are capped at 18%
per year until the full increased amount is met. It is estimated that, nationally, ¾ of the
approximately 4.9M policies will see some price increases.
• Although FIRMs will no longer be used to rate flood insurance, the FIRMs will still be used for
floodplain management purposes (determining flood regulations for construction in the SFHA)
and by lending institutions to determine if flood insurance is mandatory for a structure.
3

• Flood Insurance Policies Changes
• Will this lead to changes in development in
the SFHA?
• What’s going on legislatively?
THE
NATIONAL
FLOOD
INSURANCE
PROGRAM
• Charlotte County, along with other communities throughout the nation, have seen
increases in the NFIP flood insurance premiums.
• The future of FEMA’s program may need to include changes in development practices in
these high-risk areas and to include maps that will show future conditions. Floodplain
Managers and community officials are being asked to review the overall NFIP program
and provide input.
• Currently, there are attempts to reduce the 18% annual cap down to 9% – to make it
easier on people with fixed incomes so that a flood insurance requirement doesn’t price
them out of their homes. We continue to watch what is going on with Risk Rating 2.0
and will report if any changes to this annual cap occur.
4

County < -$100 $-100 to $-90 $-90 to $-80 $-80 to $-70 $-70 to $-60 $-60 to $-50 $-50 to $-40 $-40 to $-30 $-30 to $-20 $-20 to $-10 $-10 to $0
Charlotte County 0.8% 0.1% 0.1% 0.1% 0.1% 0.2% 0.2% 0.3% 0.5% 0.8% 3.5%
Percentage of policies that will DECREASE in cost. Amounts shown are per month.
Percentage of policies that will INCREASE in cost. Amounts shown are per month
County $0 to $10 $10 to $20 $20 to $30 $30 to $40 $40 to $50 $50 to $60 $60 to $70 $70 to $80 $80 to $90 $90 to $100 > $100
Charlotte County 48.0% 31.7% 11.5% 0.8% 0.4% 0.3% 0.2% 0.1% 0.1% 0.0% 0.1%
FEMA.gov 2021
FEMA.gov 2021
CHARLOTTE COUNTY RISK RATING 2.0
FLOOD INSURANCE PREMIUMS STATISTICS
Total 6.7%
Total 93.3%
Charlotte County’s flood insurance policy cost statistics are listed above. The statistics
shown indicate that while approximately 6.7 percent of flood insurance policies will see
a decrease annually, over 93 percent will see increases.
As stated earlier, increases are capped at 18% per year until the full increased amount is
met. For some, this glide path to their actuarial amount could take years.
5

6
UNDERSTANDING THE UPCOMING CHANGES
TO THE FEMA FLOOD MAPS
Although the flood insurance changes and the changes to our flood maps are timed closely
– they are not related. Our flood maps are changing because of a nation-wide effo
rt by
FEMA t
o update the entire coastline of the US. This has been going on for year
s.
6

• Flood Zones
• V / VE
• A / AE
• X , X shaded, D = Low, moderate, and
unknown risk flood zones
• NEW Flood Zone – Coastal A Zone (CAZ)
• Construction Requirements
• Preliminary flood map vs Current fl
ood
map s
tatistics
High-risk 1% chance
100-year flood
• Charlotte County’s current flood maps include areas identified by FEMA as high-risk
flood zones. Those zones start with the letter ‘A’ or ‘V’. These areas trigger the
mandatory requirement for flood insurance and flood regulated construction.
• The A flood zones are areas of the 1% chance flood that are typically inland, and along
rivers. The V flood zones refer to the 1% chance flood with velocity. These are the areas
that are impacted by wave action.
• When the new flood maps go into effect, they will include a NEW flood zone – the
Coastal ‘A’ flood zone. This is the area that lies between the ‘V’ flood zone (high wave
action) and the ‘A’ flood zone. This area still has wave action, but the wave heights are
lower, cresting from 1.5’ to 3’ high.
• This Coastal ‘A’ flood zone will require the same construction regulations as the ‘V’ flood
zone.
• Per the FEMA contractor AECOM – there was 4,442 parcels taken out of the SFHA, and
3,858 put into the SFHA.
• In Charlotte County, there are approximately 44,628 parcels in the SFHA and 47,097 that
are outside of the SFHA. This means nearly 50% of the county is located in the FEMA
designated high-risk (SFHA) flood zone.
7

8
• Current Flood Maps vs
Pr
eliminary Flood Maps
• Charlotte County’s
Coastal Risk Map update
• Vertical Datum Changes
• Charlotte County’s current flood maps were updated and adopted in 2003 – 19 years
ago. Since then, there have been small map revisions but no large formal update.
• We received our preliminary flood maps in late 2019 and we had public meetings in
early 2020 – before the pandemic. The pandemic did put a pause on the process, but
FEMA restarted the process and the preliminary flood maps will go into effect on
December 15, 2022.
• There will be a change in the vertical datum with the new flood maps. We will move
from the current NGVD29 datum to the more current NAVD88 datum.
• NAVD88 datum will have an average vertical difference of 1.15’ (lower) than the
NGVD29 datum.
8
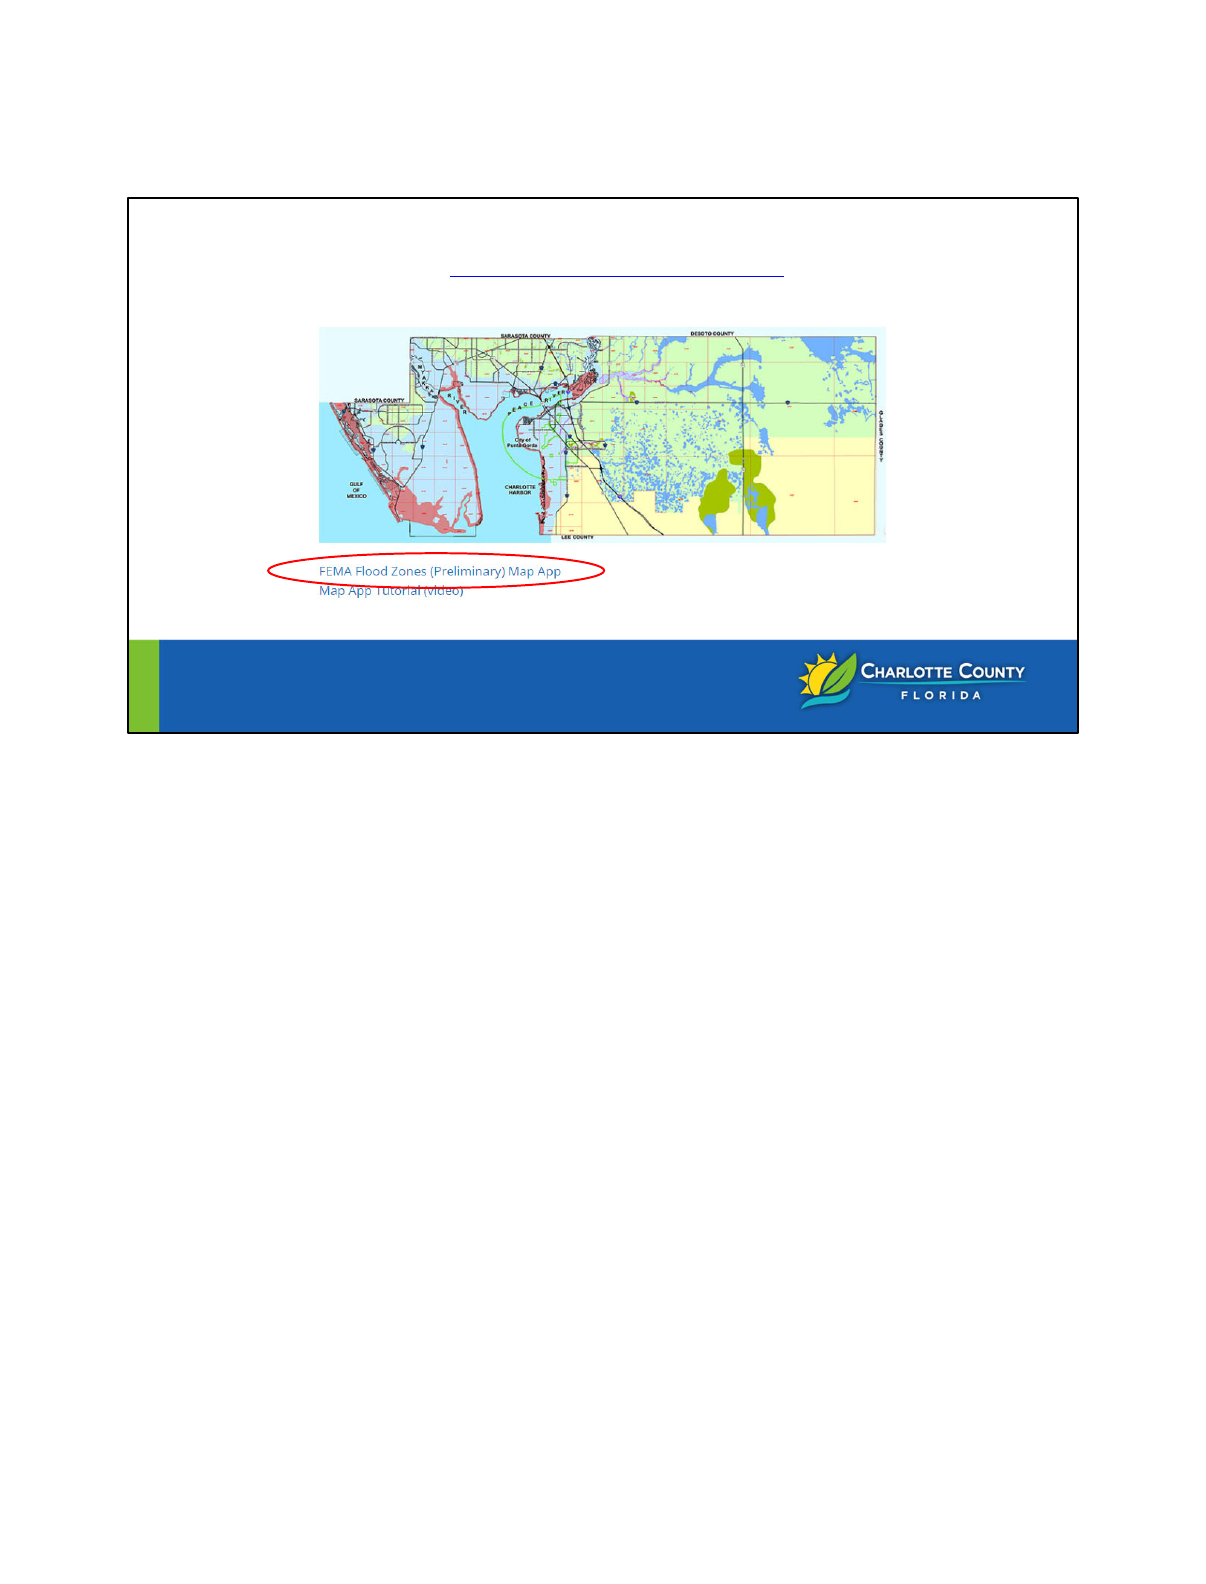
9
To view the preliminary flood maps, go to:
www.CharlotteCountyFL.gov/flood
and click FEMA Flood Zones (Preliminary) Map App
9

Donna Bailey, CFM
Floodplain Coordinator
941.623.1080
CONTACT
INFORMATION
10
